The 5 Metrics Every 3PL Needs to Survive Peak Season

How do 3PLs stay in control during peak season?
By: Blake Read, Account Executive at Octup
3PLs stay in control during peak season by replacing end-of-day exports with a live dashboard that tracks orders, SLA health, and client performance in real time. Octup's Peak Season Dashboard gives your team a complete view across fulfillment status, operational efficiency, and brand-level churn risk — so you're fixing problems before clients flag them, not after the damage is done.
Every year, it happens.
One of your brand clients decides to run a surprise 40% off sale for Black Friday. No heads-up. Just thousands of orders hitting your system overnight.
One of your warehouses was already tight on staff, and now that same site is behind on another brand’s SLAs. Emails start piling up. Your CS team scrambles for answers. You’re three steps behind and it’s only Tuesday.
This is what peak season looks like for most 3PLs. It’s not that you didn’t plan. You ran forecasts, you brought on seasonal labor. But the problem isn’t effort, it’s visibility.
Peak Season Hits Harder When You Can’t See the Whole Picture
Most 3PLs don’t realize there’s a problem until a client points it out. That’s the gap we built the Octup Peak Season Dashboard to fill.
The peak season dashboard is about helping your team thrive through Q4. Not by chance, but through key metrics that give you real visibility and better control.
What’s In The Dashboard?
We’re not just giving you a few top-line stats. The Octup Peak Season Dashboard is a complete control panel, built specifically for 3PLs who need to see everything that matters in one place.
You get a full view across four key areas:
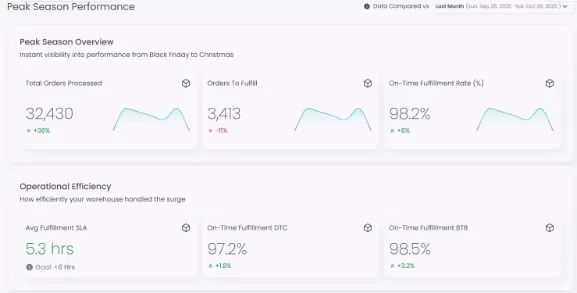
Peak Season Overview
This shows how busy your operation is and how well you’re performing under pressure. You’ll see total orders processed, orders to fulfill, and your on-time fulfillment rate, so you know exactly where you stand, every day.
Operational Efficiency
This is your performance check. You’ll see average fulfillment SLA in hours, throughput by shift, and how on-time you’re shipping for both DTC and B2B. If you’re falling behind, this is where it shows up first.
Order Status
This section gives you a real-time look at what’s done, what’s pending, and what’s at risk. It’s where you spot late orders before they hit CS. You’ll also see upcoming deadlines, orders due today, and the next SLA window.
Client Performance
Here’s where you get strategic. This view breaks down performance by brand, so you know who’s driving volume, who’s falling behind, and which clients might be at churn risk. You can compare fulfillment speed, volume, and SLA success across every account.

And you’ll see these Key Metrics at a glance:
- Orders to Fulfill Today
- Total Orders Processed
- Late Orders
- On-Time % (for DTC and B2B)
- On-Time Fulfillment %
- Avg Fulfillment SLA
These are daily indicators that show you where things are going sideways before brands start asking questions
From Firefighting to Focused Action
Your WMS wasn’t built to help you think ahead. Octup sits on top of your systems and gives you a real-time view of what’s working and what’s at risk. We can get you onboarded so you can get real answers now, not after you no longer need them.
You Don’t Get a Second Shot at This Year’s Peak Season
This quarter is the one your brands care about most. If you’re still relying on exports and end-of-day reports, you’re already behind.
Octup gives you the clarity to stay ahead. See the orders that matter. Fix the issues before they hit CS. And give your clients a reason to stay, renew, and grow with you.
Book a demo. Get your dashboard. Stay in control.
FAQs
Why do 3PLs fall behind during peak season even when they've planned ahead?
Most 3PLs plan for peak season volume but lose control when surprises hit — an unannounced brand sale, a tight site already behind on SLAs, emails piling up by Tuesday morning. The problem isn't effort, it's visibility. When your team can't see what's at risk until a client points it out, you're always three steps behind. Real-time dashboards close that gap before it opens.
What metrics should a 3PL track during peak season?
The six metrics that matter most during peak season are orders to fulfill today, total orders processed, late orders, on-time percentage for both DTC and B2B, overall on-time fulfillment rate, and average fulfillment SLA in hours. Tracked live, these indicators show you where things are going sideways in time to act — not after your CS team is already fielding brand complaints.
How can 3PLs monitor SLA performance across multiple brands during Q4?
Monitoring SLA performance across brands during Q4 requires a client-level view that breaks down fulfillment speed, volume, and SLA success per account — not just aggregate warehouse stats. Octup's Peak Season Dashboard surfaces which brands are on track, which are slipping, and which are at churn risk, so your team can prioritize the right accounts before a miss turns into a lost contract.
How does real-time order visibility reduce 3PL client churn during peak season?
Client churn during peak season almost always starts with a late order the brand spotted before you did. Real-time order status visibility — showing what's done, what's pending, and what's at risk — lets your team catch and fix issues before they hit CS. When brands see consistent on-time performance through their busiest quarter, they renew. When they don't, they start looking elsewhere.

Octup


About the Author: Blake Read
Blake Read is an Account Executive at Octup. Blake has spent his career inside 3PLs and e-commerce fulfillment. Before Octup, he was Fulfillment Senior Account Executive at LVK Logistics, a tech-forward 3PL powered by ShipHero, where he worked directly with brands navigating the realities of outsourced fulfillment. Earlier, he helped scale a 3PL to 8-figure ARR across operations, sales, and customer success, and started out at e-com fulfillment provider Cargo Cove (acquired by ShipHero in 2021). Nearly a decade inside 3PLs and e-com brands means he's lived every role on both sides of the fulfillment conversation. Connect with Blake on LinkedIn.
.webp)
.webp)